Cotality have crunched the numbers from the last quarter and here they are! The key Perth statistics and market conditions pulled directly from the November 2026 Monthly Housing Chart Pack by Cotality Australia.
1. Property Values & Market Cycles
- Recent Monthly Fall: Perth dwelling values fell 1.7% over the 28 days leading up to November 9, 2026.
- Quarterly Decline: Over the three months to October 2026, values dropped 5.7%, making Perth (alongside Brisbane) one of the capitals experiencing a sharper downturn than historical averages.
- Annual Growth: Despite the recent quarterly pullback, Perth values remain 3.9% higher over the 12-month period to October 2026.
- Drop from Peak: Following its cyclical peak in April 2026, Perth dwelling values have pulled back by 8.9%.
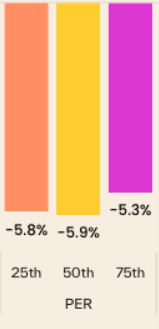
- By Value Segment (Quarterly Change): The downturn is hitting different price brackets similarly:
- Lowest 25% of values: -5.8%
- Middle 50% of values: -5.9%
- Highest 25% of values (top tier): -5.3%
2. Sales, Listings & Selling Conditions
- Annual Sales Volumes: Sales volumes over the 12 months to October fell significantly, down 21.4% compared to the previous year—the sharpest drop of any capital city.
- Total Listings Surge: Even though fewer new properties are hitting the market, total properties listed for sale in Perth surged 71.7% higher compared to this time last year, indicating stock is lingering longer.
- Days on Market: The median time it takes to sell a property has increased to 28 days (up from just 9 days a year ago), though it remains one of the faster-moving capitals alongside Hobart.
- Vendor Discounts: Sellers are having to offer larger discounts to close deals. The median vendor discount widened to 5.3% over the three months to October 2026 (almost double the 2.7% discount seen a year prior).
3. Rental Market & Yields
- Rental Growth: Annual rental rates grew by 7.5% over the 12 months to October 2026. (Meanwhile, Regional WA rents grew by 6.5%).
- Gross Rental Yields: Gross rental yields in Perth sit at 4.2%.
4. Finance, Lending & Regional WA
- New Lending Commitments (Statewide): Total home finance commitments in Western Australia grew 20.8% annually during the June 2026 quarter (comprising a 15.6% increase for owner-occupiers and a 30.1% increase for investors).
- Investor & First Home Buyer Share (WA):
- Investor Lending: Investors account for 38.1% of total lending value in WA (close to its 10-year average).
- First Home Buyers: First home buyers make up 30.6% of owner-occupier lending in WA.
- Regional WA Standout: Regional WA was a national star performer for annual growth, recording an 11.0% increase in dwelling values over the 12 months to October.